This course will give you the know how step-by-step to implement ANOM, CUSUM, EWMA, EPC and T SQUARED in your manufacturing process.
WHO SHOULD ATTEND
Upper Management, Managers, Supervisors, Engineers, Team Leaders and individuals interested in learning these real-time statistical methodologies for process quality control.
BENEFITS
When the training is completed, you will be able to implement these powerful quality tools in you manufacturing process and help you achieve the world class quality and a significant reduction to the overall cost of quality.
ANOM (Analysis of Means)
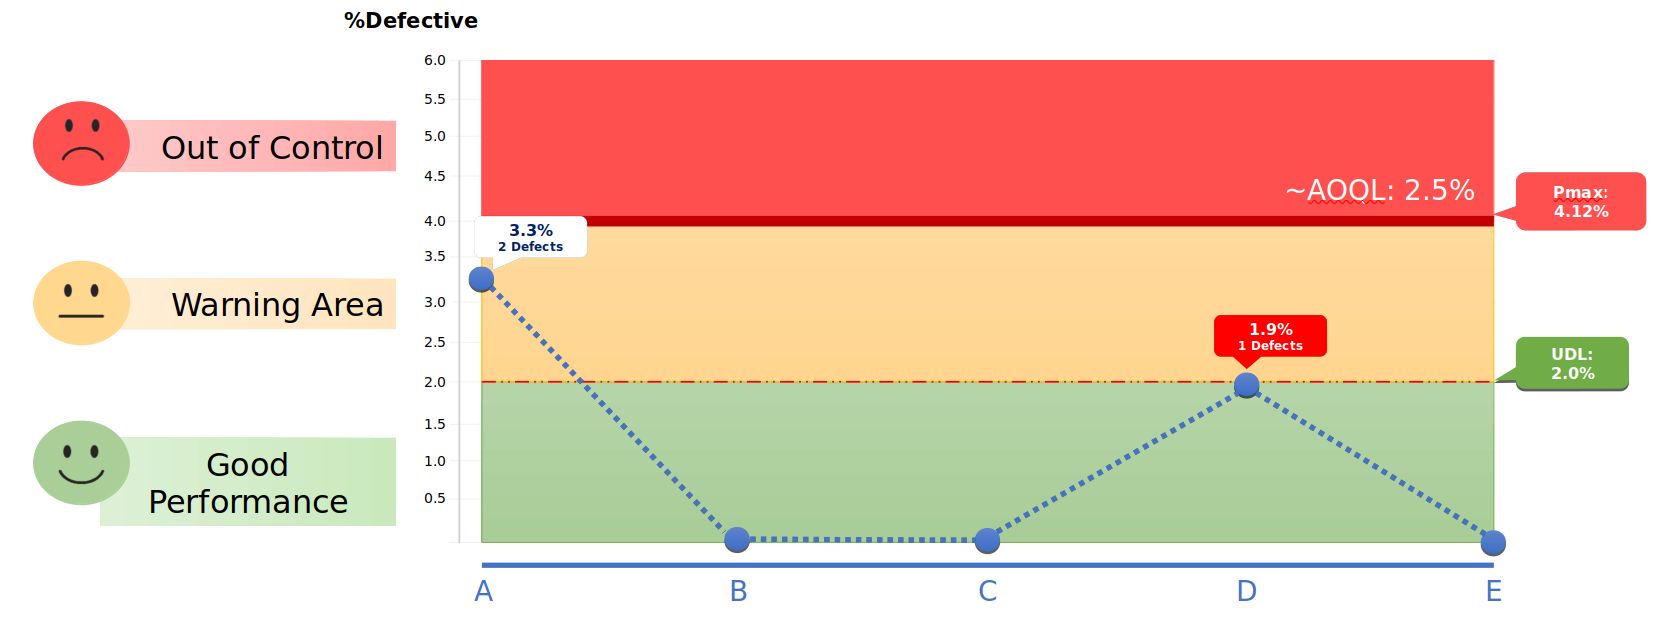
ANOM is a very effective troubleshooting graphical technique to identify specific sources of differences between machines, operators, Mfg. Lines, shifts, check points etc. Experience has shown that small samples obtained in a well-planned manner and examined carefully, usually provide more useful information for corrective action than the 100% inspection.
CUSUM (Cumulative Sum)
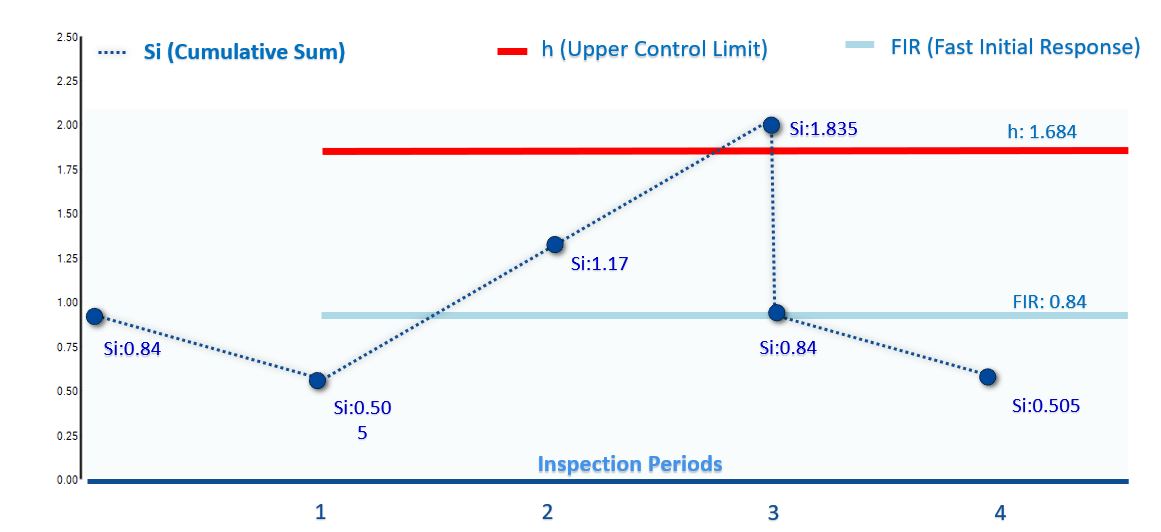
CUSUM (Cumulative Sum) control chart applies to all manufacturing continuous processes for which their product characteristics are attribute in nature. it is a proven statistical technique that is easy to mange and is highly sensitive to detect small process shifts. It’s sequential inspection performed on finished goods allows for continuous product disposition, rather than at the end of a large lot.
With CUSUM you will obtain multiple significant benefits, such as: NCR’s and Customer Complaints reduction, rework and scrap reduction, Inspection head count reduction, manufacturing product flow improvement, better utilization of the Manufacturing layout, overall the outgoing quality and the cost of quality will be improved.
EWMA (Exponentially Weighted Moving Average)
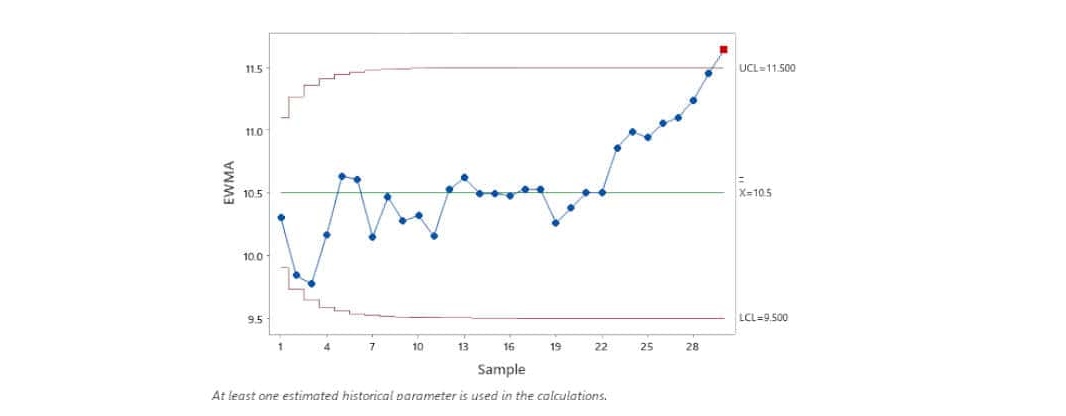
The EWMA chart is a type of control chart used to monitor small process shifts in the process mean. It weights observations in geometrically decreasing order so that the most recent observations contribute highly while the oldest observations contribute very little. The EWMA chart plots the exponentially weighted moving average of individual measurements or subgroups.
The EWMA charts will detect process shifts between 0.5 to 2 sigma's faster than Shewhart charts using the same sample size. Robustness of the EWMA control chart to non-normality issues.
Engineering Process Control
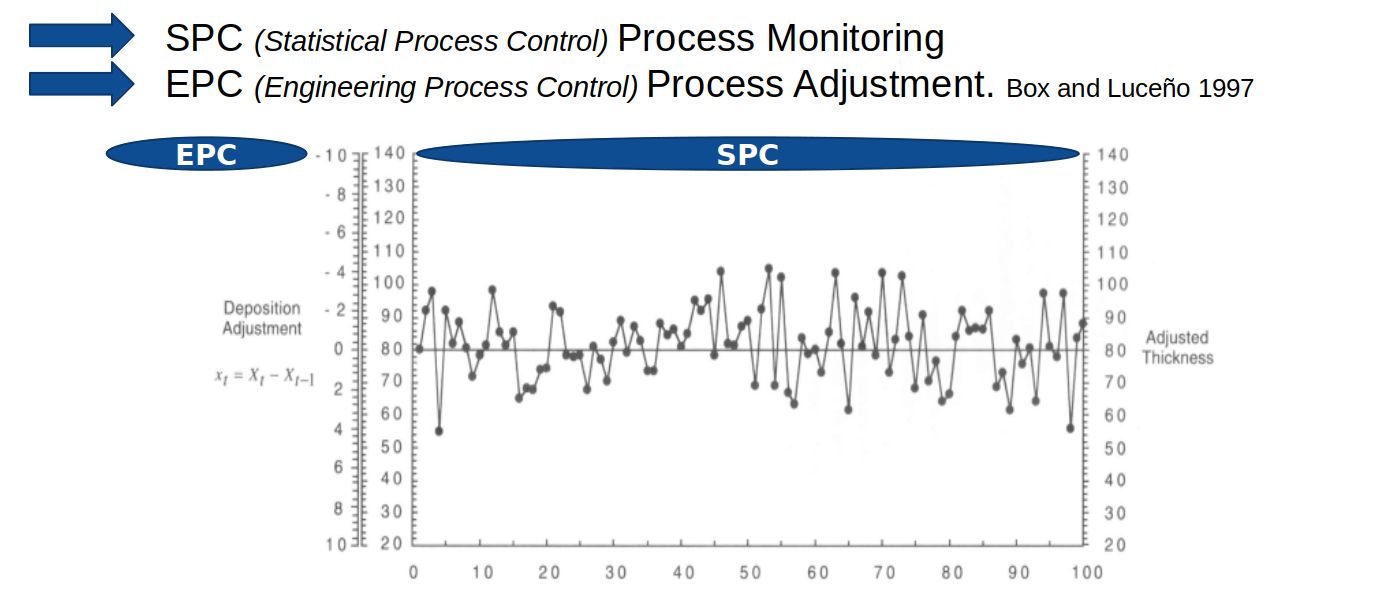
EPC is a feedback adjustment approach that will keep the process output in stochastic control close to the desired Target. The common objective between EPC and SPC is to reduce variability. However, EPC result very useful whenever the root causes can not be identified despite our best effort. The Moulding processes are typical examples.
-
SPC is focus on identifying assignable causes, so they can be removed and consequently reduce process variability.
-
EPC is focus on adjusting the process using information about its current level of deviation from a desired target. It is called feedback adjustment
HOTELLING’S T SQUARED
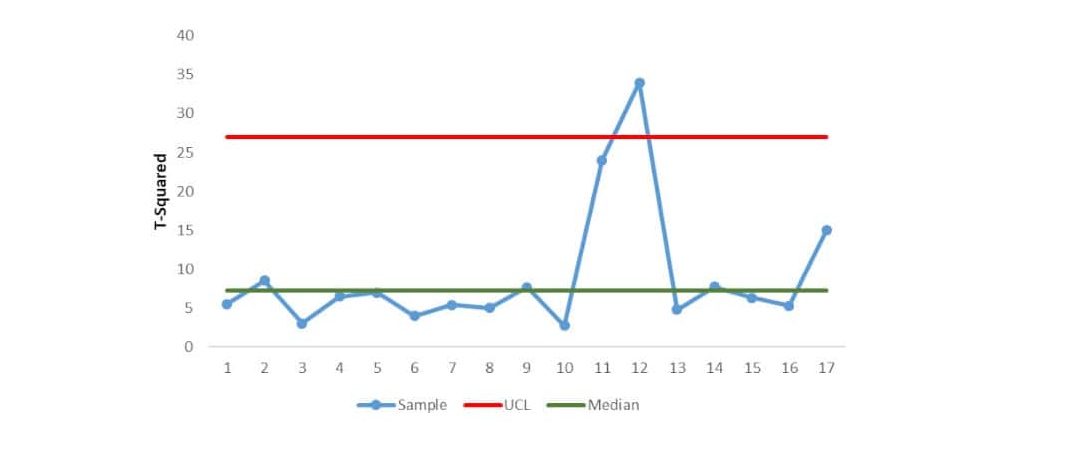
Hotelling’s T Squared – The next generation of SPC. It is a technique for monitoring the overall quality of several characteristics. It is a powerful statistical process monitoring technique applicable in modern manufacturing automated processes, in which product characteristics have some level of dependence. Hotelling T Squared using real-time process data from a set of measurable characteristics and with just one control chart will be sufficient to accept or declare the process out of control and consequently take immediate action.
TRAINING TOPICS:
Introduction
- Concepts Review
- SPC
- Acceptance Sampling Plans
- Sequential Inspection Analysis
- Process Control by Feedback Adjustment
- Multivariate Process Monitoring
ANOM (Analysis of Means)
- Applications
- Statistical background
- Chart design
- Examples
CUSUM (Cumulative Sum Control Chart)
- Applications
- CUSUM vs ANSI Z1.4 advantages
- Statistical background
- Chart design
- Examples
- Use of ANOM & CUSUM Software
EWMA (Exponentially Weighted Moving Average)
- Applications
- EWMA vs Shewhart Charts advantages
- Chart Design using MINITAB
- Examples
EPC (Engineering Process Control)
- Application
- Statistical Background
- Chart Design using MINITAB
- DOE Factorial
- Regression Analysis
- EPC Stochastic equation
- Examples
Combining EPC (Engineering Process Control) and SPC (Statistical Process Control)
-
Application
-
EPC and SPC are two different but complimentary approaches with a common goal; the reduction of variation of process.
- SPC attempts to remove disturbances using ➢ PROCESSS MONITORING.
- EPC attempts to compensate them using ➢ PROCESS ADJUSTMENT.
- Statistical Background
- Chart Design using MINITAB
- DOE Factorial
- Regression Analysis
- EPC Stochastic equation
- Examples
Hotelling’s T Squared
- Applications
- Statistical background
- Chart design using MINITAB
- Examples
